The JEB 2.3.2 release contains several enhancements of our JDWP and GDB/LLDB1 debugger clients used to debug both the Dalvik bytecode and native code of Android applications.
Dynamically loaded DEX files
In this post, we wanted to highlight a neat addition to our Dalvik debugger. Up until now, we did not support debugging several DEX files within a single debugging session. 2
So, we decided to add support for debugging DEX files loaded in a dynamic fashion. Below is a use-case, step-by-step study of a simple app whose workflow goes along these lines:
- A routine in the principal classes.dex file looks for an encrypted asset
- That asset is extracted and decrypted; it is a Jar file containing additional DEX bytecode
- The Jar file is dynamically loaded using DexClassLoader, and its code is executed
Now, we want to debug that additional bytecode. How do we proceed?
An example of debugging dynamically loaded bytecode
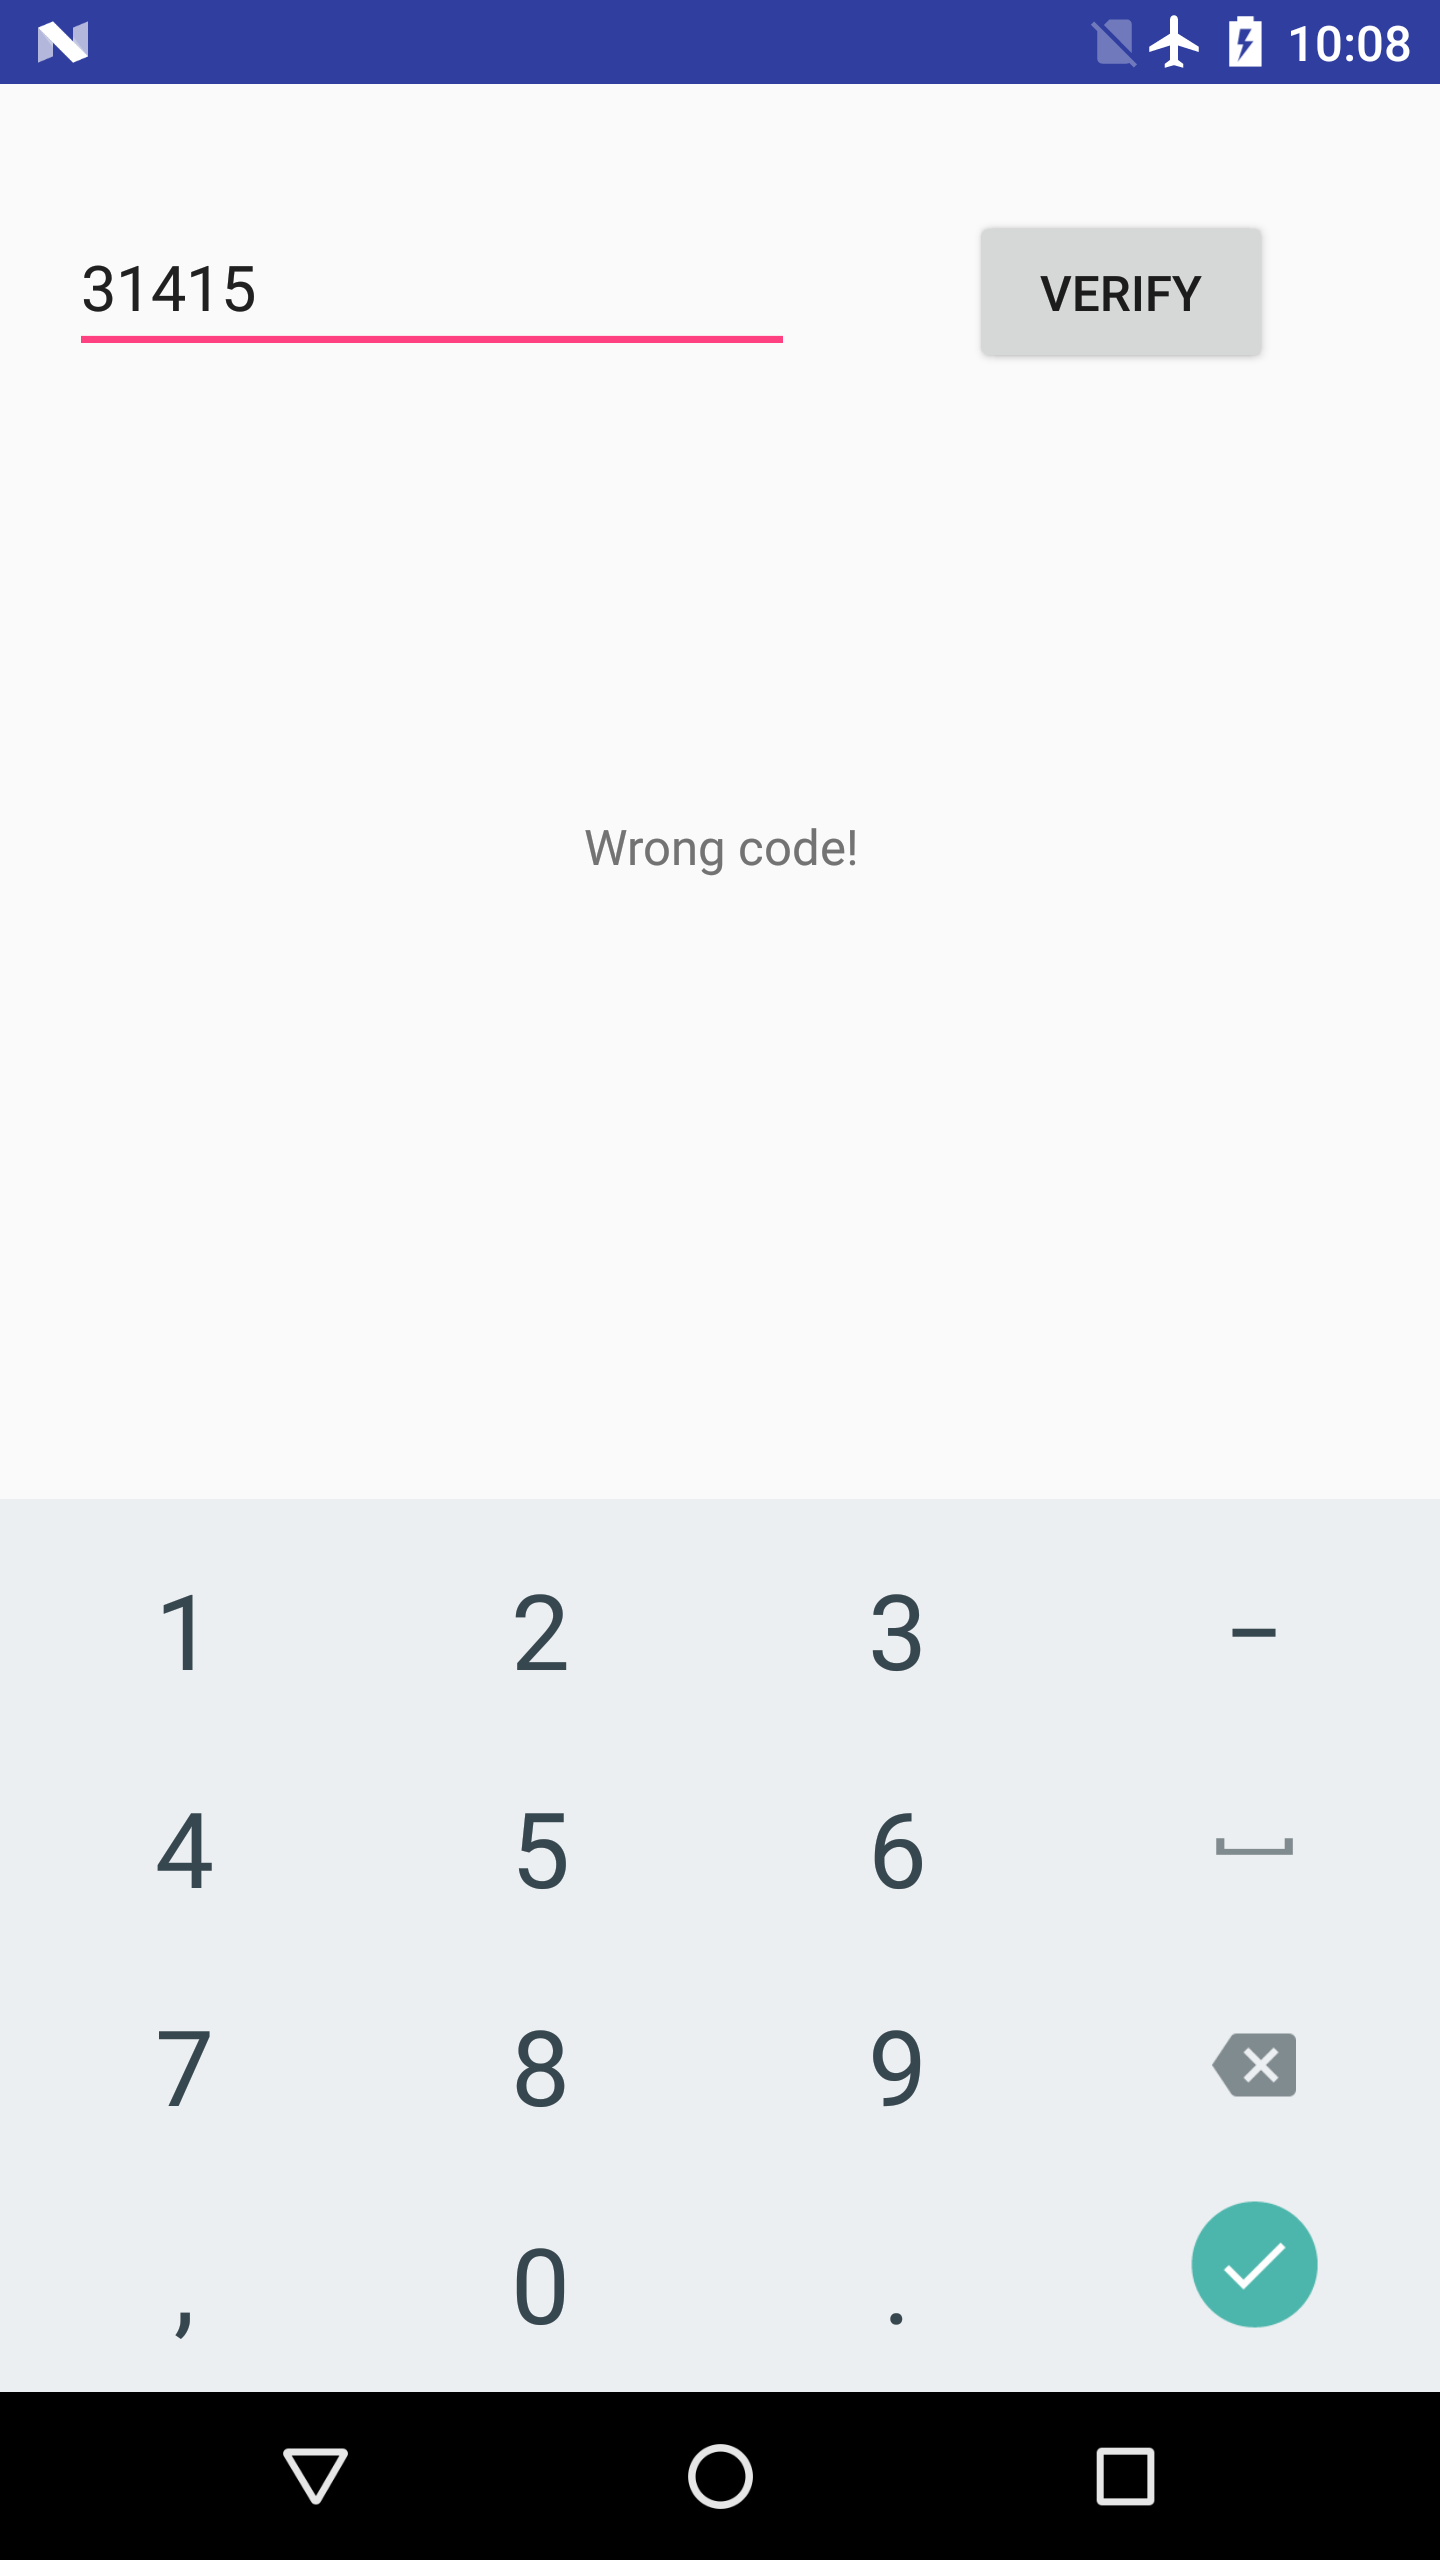
The app is called EnDyna (a benign crackme-like app, download it here). It offers a simple text box, and waits for the user to input a passcode. When entering the proper passcode, a success message is displayed.
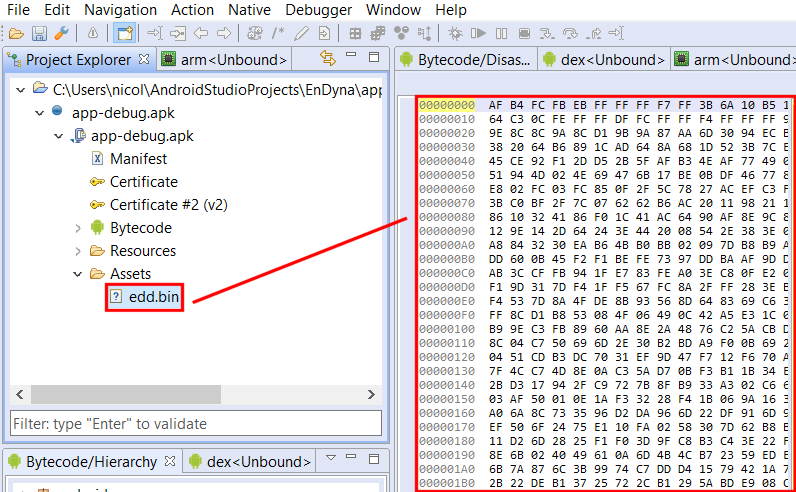
Open the app in JEB. It contains a seemingly-encrypted asset file called edd.bin.
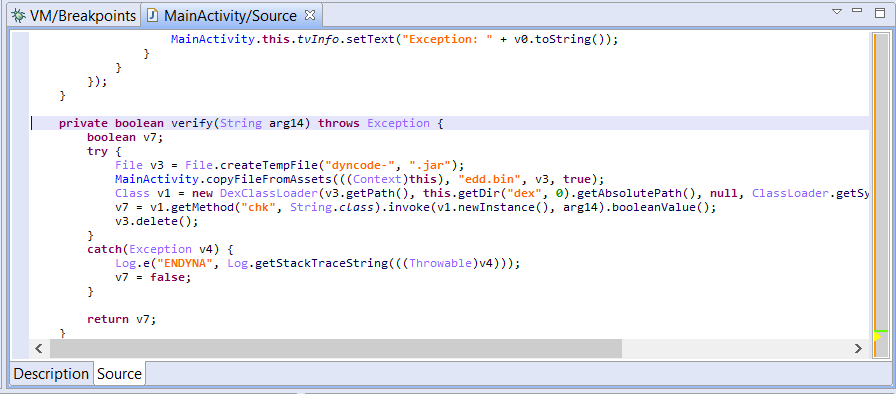
A closer look at the MainActivity class shows that the edd.bin file is extracted, decrypted (using a simple XOR cipher) and loaded using DexClassLoader in order to validate the user input.
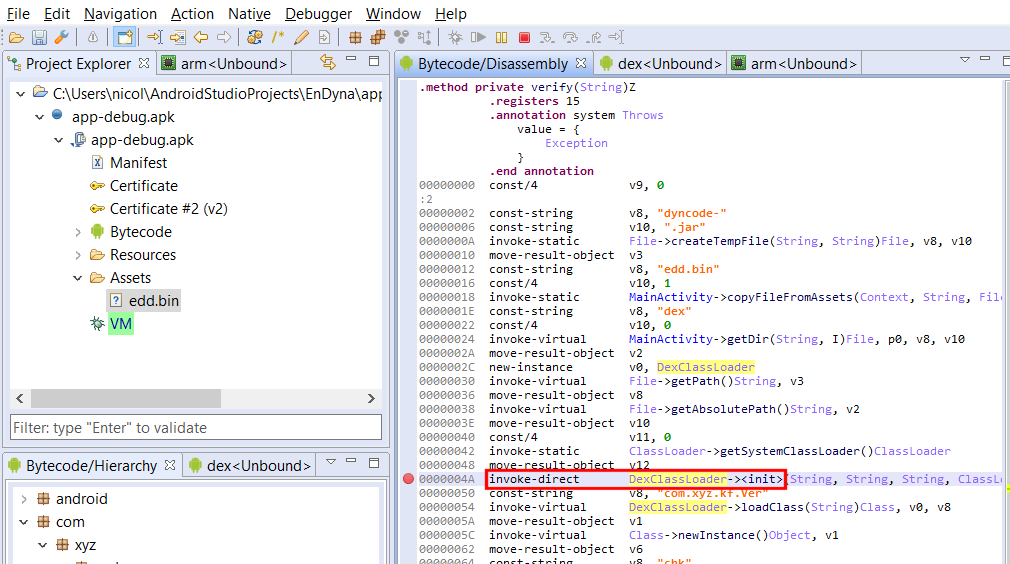
Let’s attach the debugger to the app, and set a breakpoint where the call to the DexClassLoader constuctor is made.
We then trigger the verify() routine by inputting a passcode and hitting the Verify button. Our breakpoint is immediately hit. By examining the stackframe of the paused thread, we can retrieve the class loader variables and see where the decrypted DEX file was written to – and is about to get loaded from.

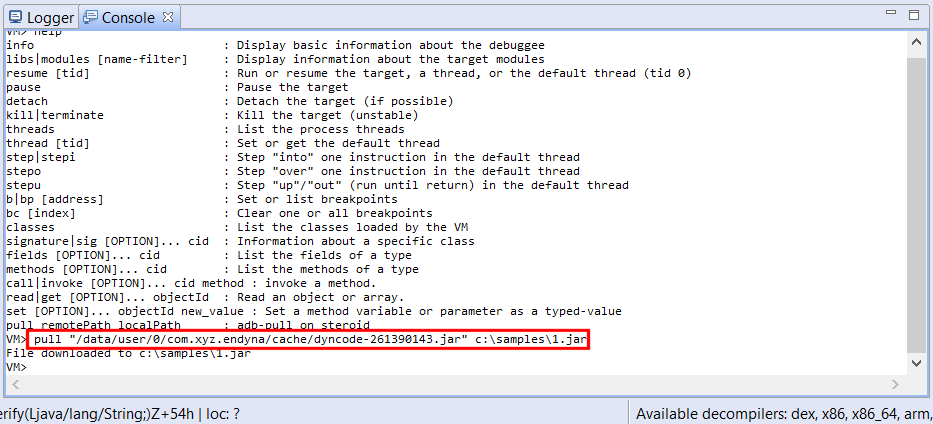
We use the Dalvik debugger interpreter to retrieve the file (command “pull”).
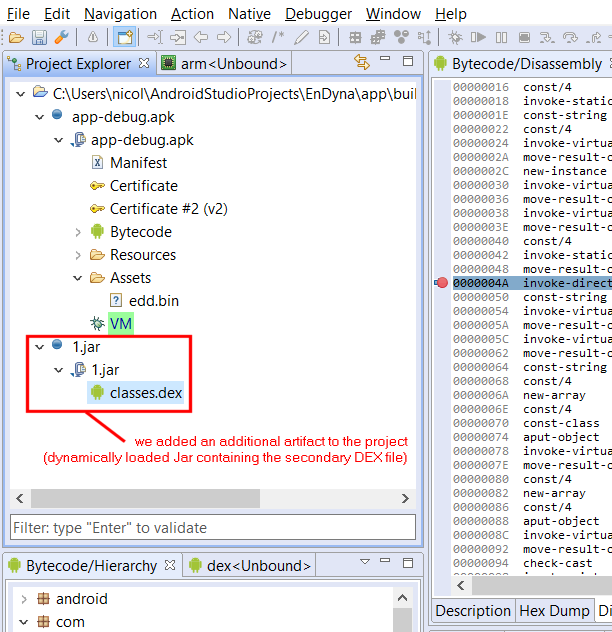
We now have the Jar file containing our dynamically-loaded DEX file in hand! We load it in JEB by adding an additional artifact to the project (command File, Add an Artifact…).
After processing is complete, the Android debugger notices that the added artifact contains a DEX file, and integrates it in its list of managed units.
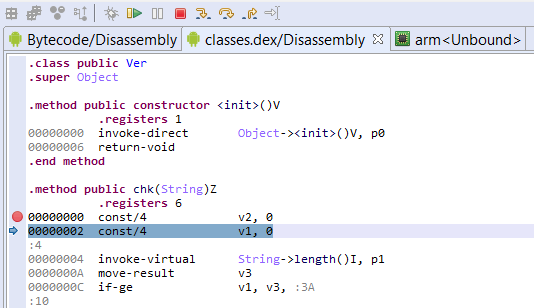
We can set a breakpoint on the method of the second DEX file that’s about to be called.3
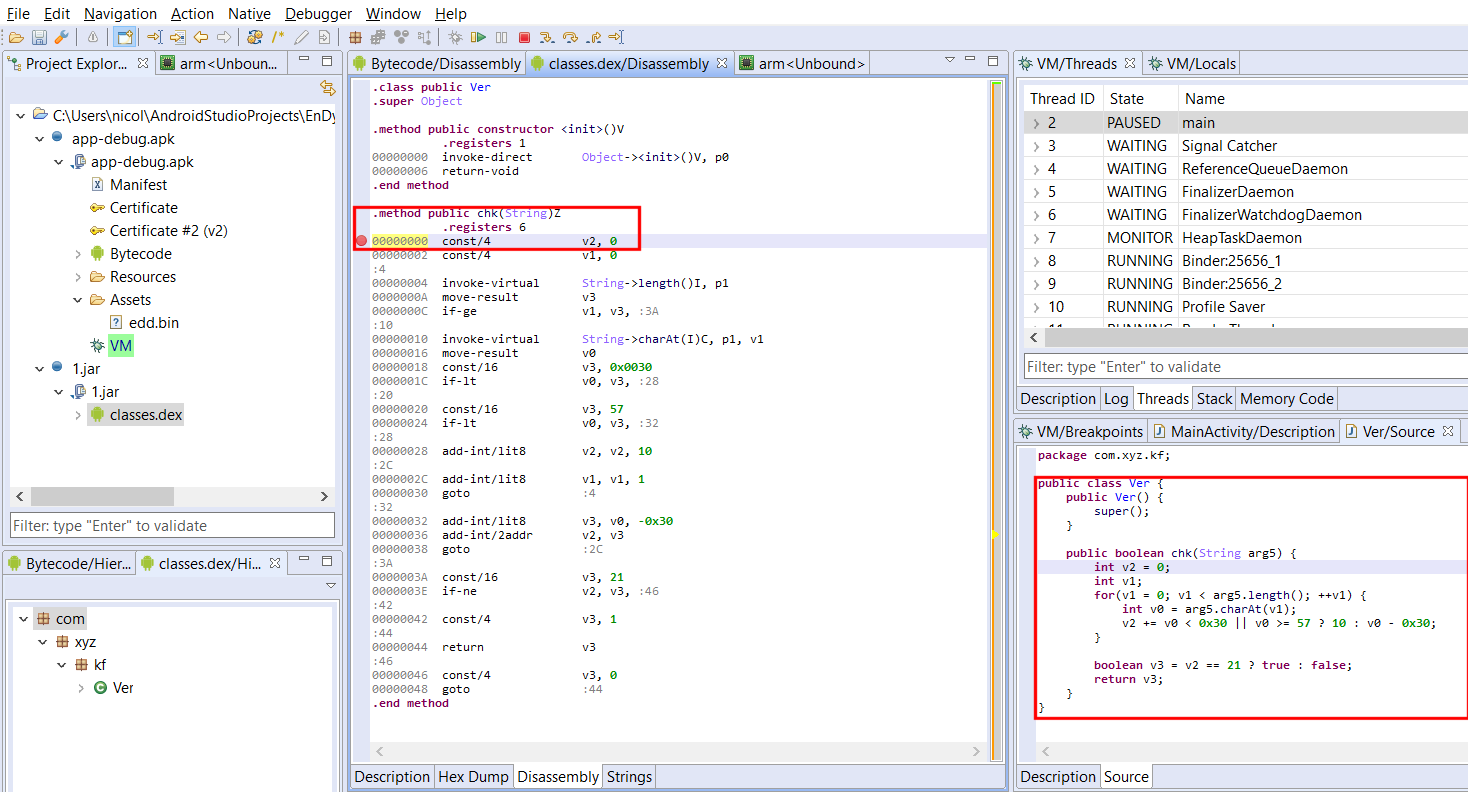
We resume execution, our breakpoint is hit: we can start debugging the dynamically dropped DEX file!
Of course, all of the above actions can be automated by a Python script or a Java plugin. (We will upload a sample script that hooks DexClassLoader on our public GitHub repository shortly.)
We published a short video that demos the above steps, have a look at it if you want to know precisely the steps that we took to get to debug the additional DEX file.
Thank you – stay tuned for more updates, and happy debugging!
- Our native GDB debugger client underwent a major revamp, as we upgraded to the LLDB debugger server instead of gdbserver. More details in a separate post! ↩
- It was a non-issue for standard multi-DEX APKs since JEB automatically merges them into a single, virtual DEX file, bypassing the 64Kref limits if it has to ↩
- Note that the class in question (com.xyz.kf.Ver) may not even be loaded at this point; it is perfectly fine to do so: JEB handles dynamically loaded types fine and will register breakpoints timely and accordingly. ↩
How to get source code of prptected dex files